Beyond the fundamentals of breakpoints, stepping, and variable inspection, Visual Studio offers a wide range of powerful debugging tools that can greatly enhance your troubleshooting and development workflow. These advanced tools provide deep insights into your code’s behavior, allowing you to identify and resolve issues quickly and efficiently. Let’s delve into some of these advanced debugging features:
-
Conditional Breakpoints: Conditional breakpoints allow you to specify certain conditions that need to be met before the debugger breaks execution. This fine-grained control helps you pinpoint specific scenarios or occurrences, reducing the need for manual debugging and simplifying the process.
-
Data Breakpoints: Data breakpoints monitor specific variables or memory locations and pause execution when their values change. This functionality is particularly useful for identifying unexpected or erroneous changes in data, assisting in tracking down issues related to data manipulation and integrity.
-
Call Stack Visualization: Visual Studio’s call stack visualization provides a clear representation of the sequence of function calls that led to the current execution point. Navigating through the call stack allows you to understand the flow of control, identify the originating source of an issue, and trace the path of execution.
-
Parallel Stacks Window: For multithreaded applications, the Parallel Stacks window displays the call stacks of all threads simultaneously, enabling you to analyze their execution and interactions. This tool aids in debugging concurrency issues, deadlocks, and race conditions, providing a comprehensive view of the program’s overall behavior.
-
Exception Handling: Visual Studio’s debugging tools help manage exceptions and handle errors effectively. The debugger allows you to configure how exceptions are handled, enabling you to break on specific exceptions or ignore them, facilitating the isolation and resolution of exceptional scenarios.
-
Dynamic Watches: Dynamic watches allow you to monitor the values of expressions or variables while the program is running. These watches can be added and modified on the fly, providing real-time insights into the state of your application without the need to constantly modify code or add breakpoints.
-
SQL Server Debugging: For applications that interact with SQL Server, Visual Studio provides integrated debugging capabilities. You can step through Transact-SQL queries, examine query plans, and identify performance bottlenecks, helping you optimize database operations and resolve data-related issues.
-
Memory and Performance Profiling: Visual Studio’s profiling tools enable you to analyze the performance and memory usage of your applications. These tools help identify performance bottlenecks, memory leaks, and other inefficiencies, enabling you to optimize code and improve overall application performance.
Mastering these advanced debugging features in Visual Studio empowers you to address complex issues, improve code quality, and expedite the development process. By leveraging these tools effectively, developers can gain a deeper understanding of their code’s behavior, leading to more efficient debugging and a more robust and reliable software product.# Visual Studio’s Debugging Tools: Beyond The Basics
Executive Summary
Visual Studio offers a wide range of debugging tools that allow developers to identify and resolve issues in their code effectively. This article delves into these tools, highlighting their capabilities and offering practical guidance on leveraging them to enhance code quality and speed up the development process. By exploring advanced debugging techniques, developers can gain a deeper understanding of their code behavior and diagnose issues with greater precision.
Introduction
Debugging is an essential part of software development, facilitating the identification and resolution of issues in the code. Visual Studio provides a robust suite of debugging tools that empower developers to perform in-depth analysis and swiftly resolve problems. This article examines these tools, guiding developers in utilizing them effectively to streamline the debugging process and elevate code quality.
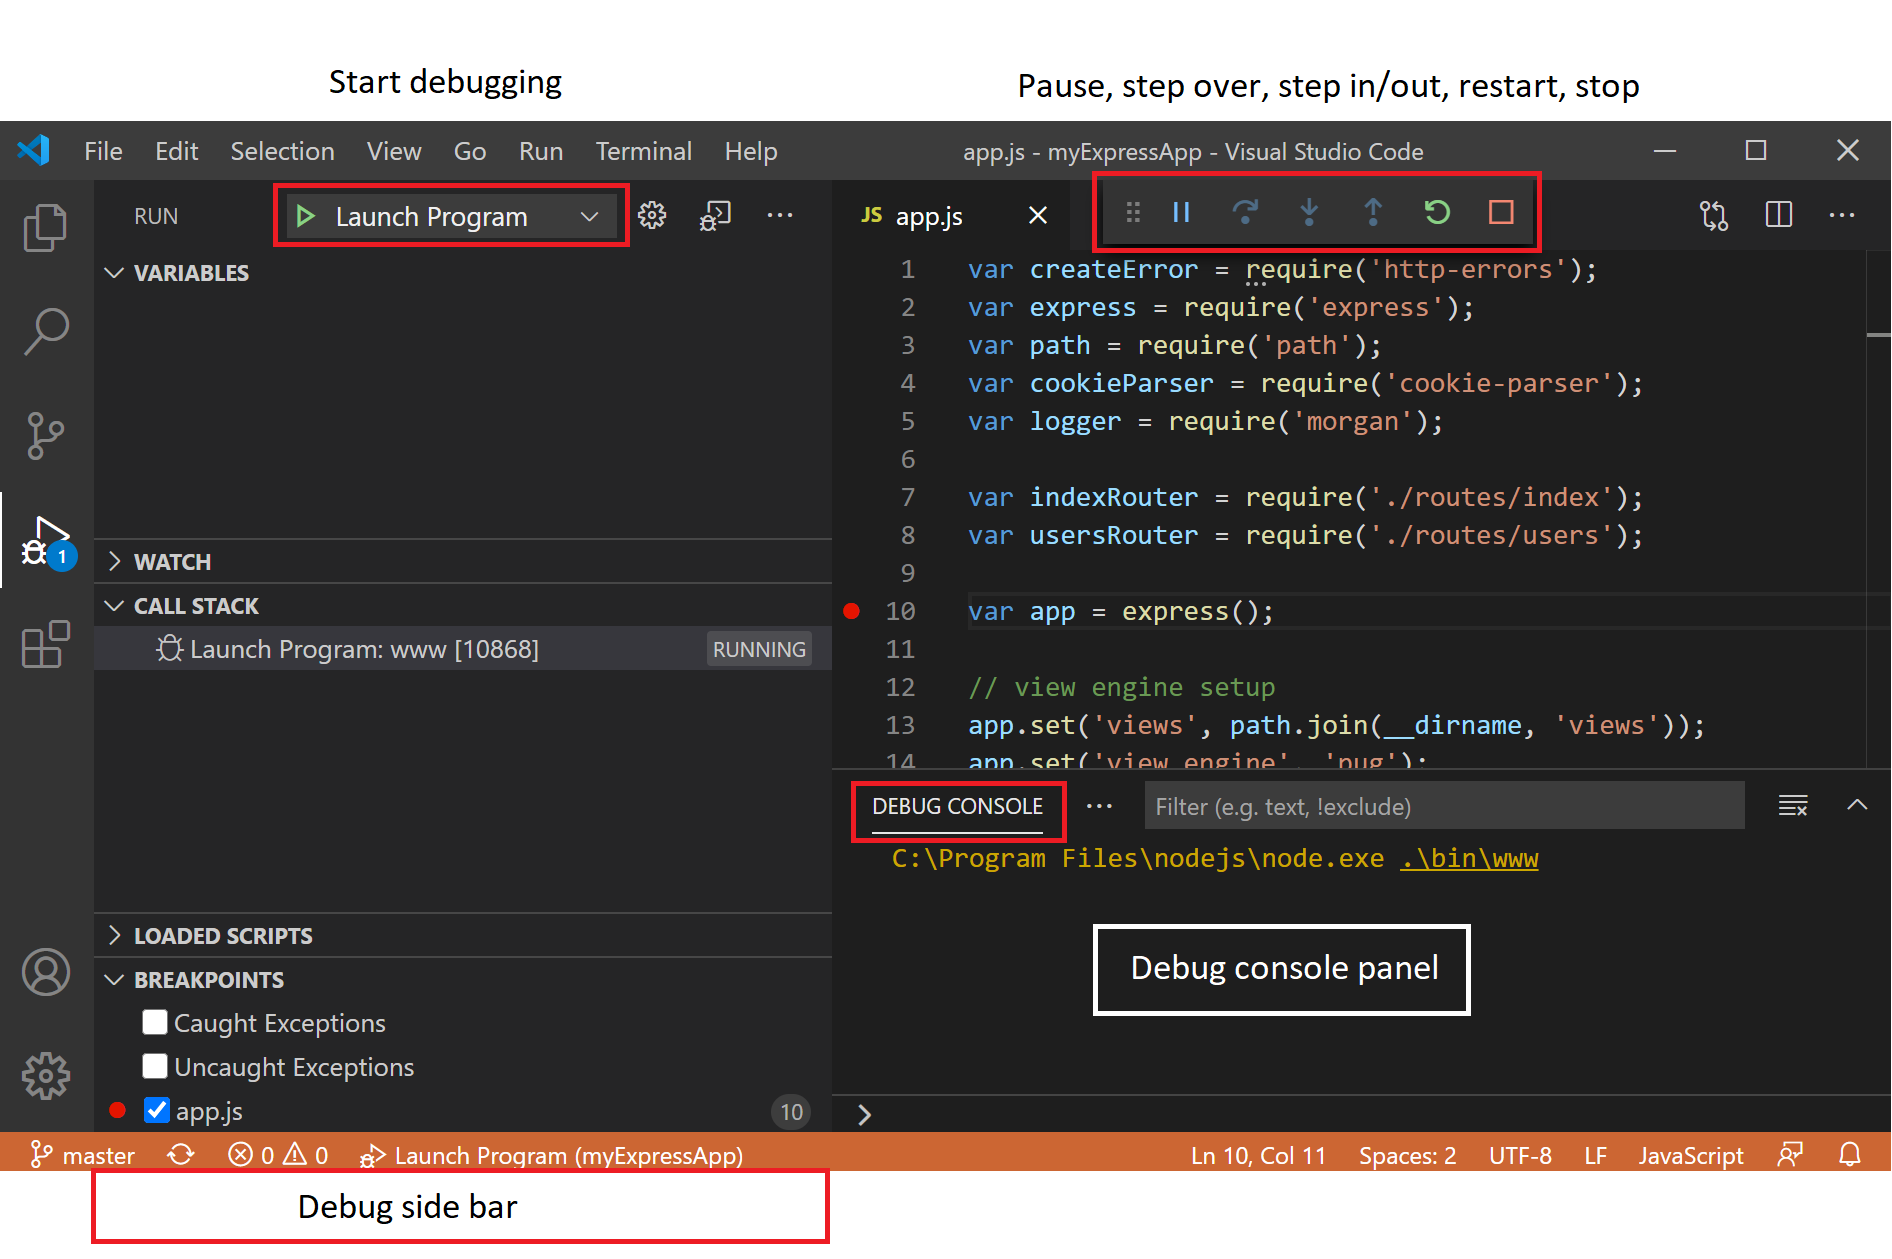
Navigating the Debugging Interface
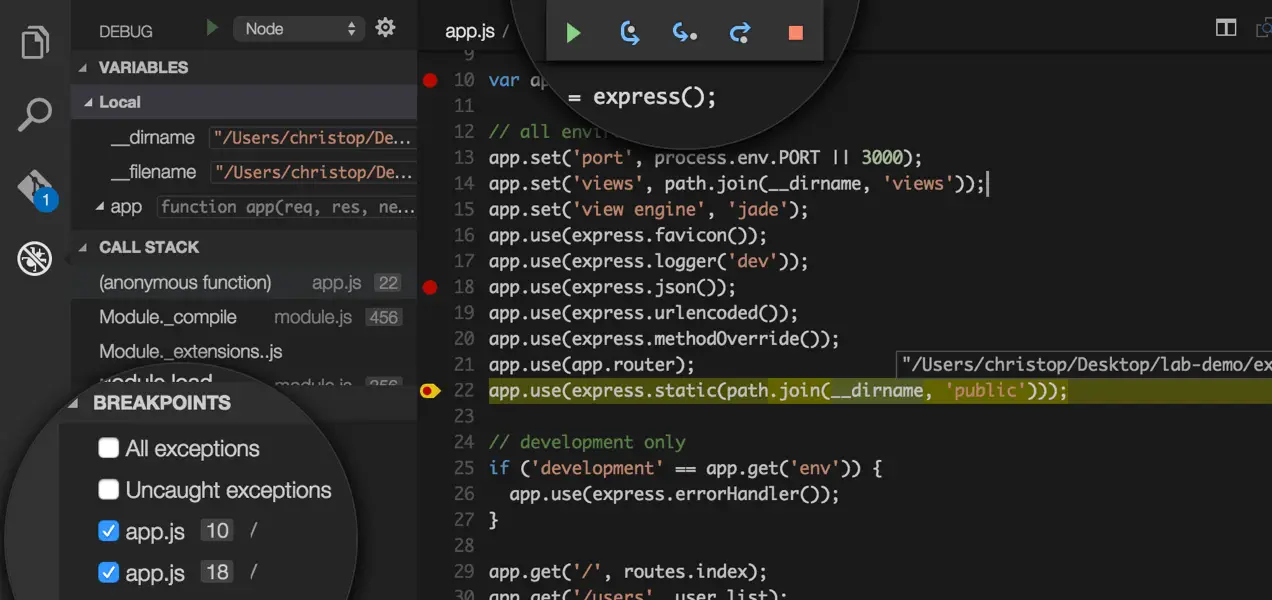
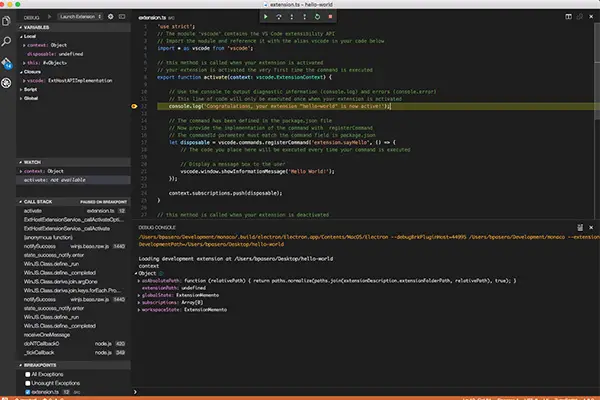
Visual Studio’s debugging interface is meticulously designed to provide a comprehensive view of the debugging process. The Debug Toolbar offers a centralized location for essential debugging commands, while the Autos, Locals, and Watch windows present crucial information about variables and expressions. The Call Stack and Threads windows enable developers to monitor the flow of execution and identify potential issues.
Utilizing Breakpoints for Controlled Debugging
Breakpoints serve as powerful instruments for controlling the execution flow of a program. Developers can strategically position breakpoints within the code to pause execution at specific points, aiding in the examination of variable values and the identification of problematic code sections. Visual Studio allows for various types of breakpoints, including conditional breakpoints and data breakpoints, providing granular control over the debugging process.
Leveraging IntelliTrace for Advanced Debugging
IntelliTrace offers a revolutionary approach to debugging by recording the execution history of a program. This enables developers to rewind and replay the program’s execution, gaining valuable insights into its behavior. IntelliTrace also facilitates the identification of intermittent issues that may be challenging to reproduce during traditional debugging sessions.
Delving into Memory and Performance Analysis
Memory and performance analysis tools in Visual Studio provide comprehensive insights into the resource utilization of a program. The Memory Profiler helps identify memory leaks and optimize memory usage, while the Performance Profiler analyzes performance bottlenecks and suggests optimizations to enhance code efficiency. These tools empower developers to create applications that are both efficient and performant.
Integrating Unit Testing for Robust Code Validation
Visual Studio seamlessly integrates with unit testing frameworks, enabling developers to automate the validation of code functionality. Unit testing facilitates the creation of test cases that verify specific aspects of the code, ensuring its correctness and reliability. By incorporating unit testing into the development process, developers can proactively identify and rectify issues, preventing them from propagating to production environments.
Conclusion
Visual Studio’s debugging tools offer a comprehensive and powerful arsenal for identifying and resolving issues in code. By leveraging these tools effectively, developers can streamline the debugging process, enhance code quality, and ensure the creation of robust and reliable software applications. Mastering these techniques empowers developers to navigate the complexities of modern software development and deliver exceptional results.
Keyword Phrase Tags
- Visual Studio Debugging Tools
- Advanced Debugging Techniques
- IntelliTrace
- Memory and Performance Analysis
- Unit Testing Integration
That’s soo intersting, outsanding
i most defenetly gonna use this
wasn’t as good as i thaught it would be
i totaly can related to this
This article is simple awfull, waste of time.
it is a bit ironic this web is giving debugging tips
This the most sarcatic article i have ever read
this debuggin tips are a total joke, go look somewhere else
the one think i really liked about this articla is the number of detaills and examples they putted.
Why would people wast theyr time reading this crap
i wonder if articles can have less details
thats the most sarcatic articla i have ever red
its nice to see someone taked about this topic, its very usefull
i have to disagree, this was not very usefull and has so many errors