Real-time Reporting Riddles: Building Live Data Dashboards
Executive Summary
Real-time reporting is a powerful tool for businesses that want to stay ahead of the competition. By providing instant insights into key performance indicators (KPIs), real-time reporting can help businesses make better decisions, identify opportunities, and avoid risks. However, building a real-time reporting dashboard can be a complex and time-consuming process. This article will provide a step-by-step guide to building a real-time reporting dashboard.

Introduction
Real-time reporting is the process of collecting, analyzing, and presenting data in real time. This data can come from a variety of sources, such as sensors, databases, and web logs. Real-time reporting dashboards are a valuable tool for businesses that want to monitor their performance and make data-driven decisions.
FAQ
Q: What are the benefits of using a real-time reporting dashboard?
A: Real-time reporting dashboards provide a number of benefits, including:
- Improved visibility into key performance indicators (KPIs)
- Faster decision-making
- Reduced risks
- Increased opportunities
- Improved efficiency
Q: What are the challenges of building a real-time reporting dashboard?
A: Some of the challenges of building a real-time reporting dashboard include:
- Collecting data from multiple sources
- Cleaning and processing data in real time
- Visualizing data in a clear and concise way
- Ensuring data security
Q: What are some best practices for building a real-time reporting dashboard?
A: Some best practices for building a real-time reporting dashboard include:
- Define your goals and objectives
- Identify the key performance indicators (KPIs) that you want to track
- Choose the right data sources
- Clean and process your data
- Visualize your data in a clear and concise way
- Ensure data security
Data Sources
The first step to building a real-time reporting dashboard is to identify the data sources that you will use. Data sources can include:
- Sensors: Sensors can collect data from the physical world, such as temperature, humidity, and motion.
- Databases: Databases can store data from a variety of sources, such as customer relationship management (CRM) systems and enterprise resource planning (ERP) systems.
- Web logs: Web logs can track user activity on websites, such as page views, click-throughs, and conversions.
Data Collection
Once you have identified your data sources, you need to decide how you will collect data from those sources. There are a number of different data collection methods, including:
- Polling: Polling is the process of periodically querying a data source for new data.
- Streaming: Streaming is the process of continuously receiving data from a data source.
- Webhooks: Webhooks are a type of API call that can be used to receive data from a website or web application.
Data Cleaning and Processing
Once you have collected data from your data sources, you need to clean and process it. Data cleaning involves removing duplicate data, correcting errors, and converting data into a consistent format. Data processing involves transforming data into a format that is suitable for analysis.
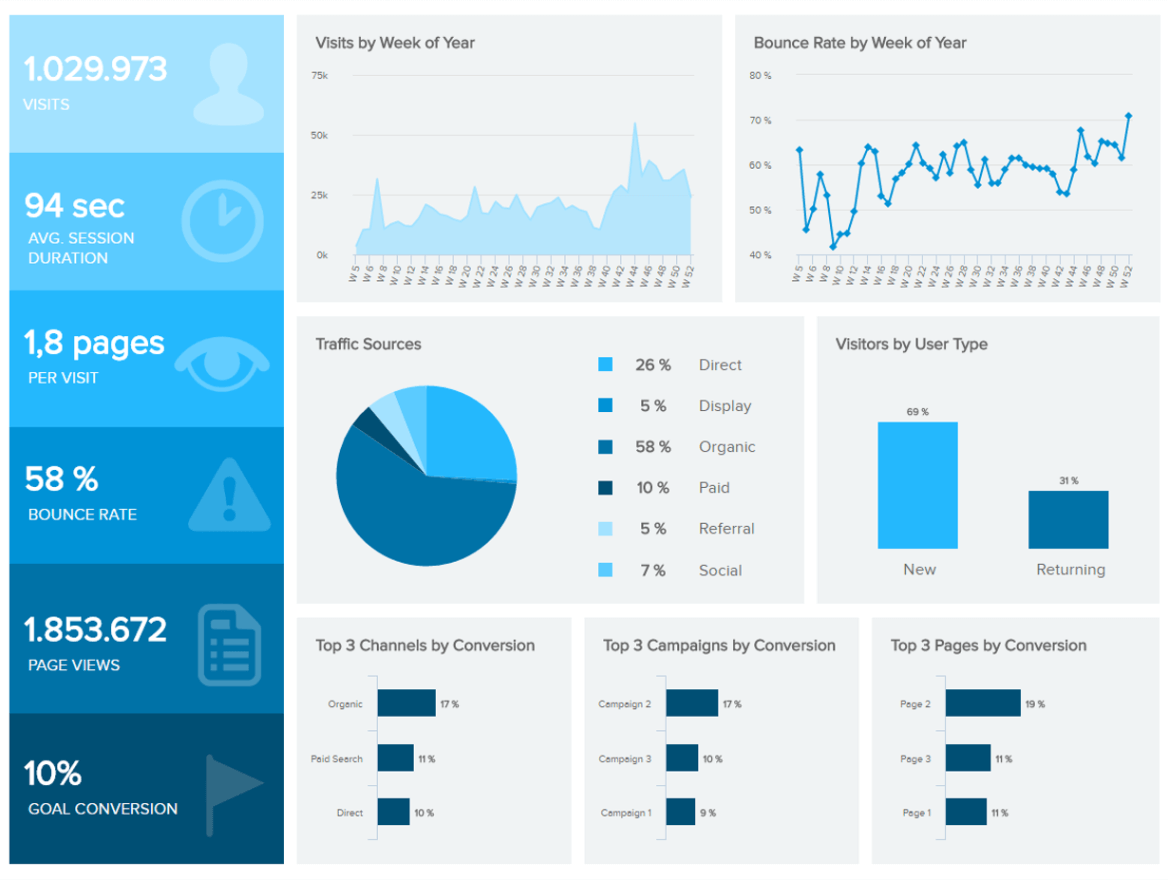
Data Visualization
The next step is to visualize your data. Data visualization is the process of representing data in a visual format, such as a chart, graph, or map. There are a number of different data visualization tools available, such as Tableau, Power BI, and Google Data Studio.
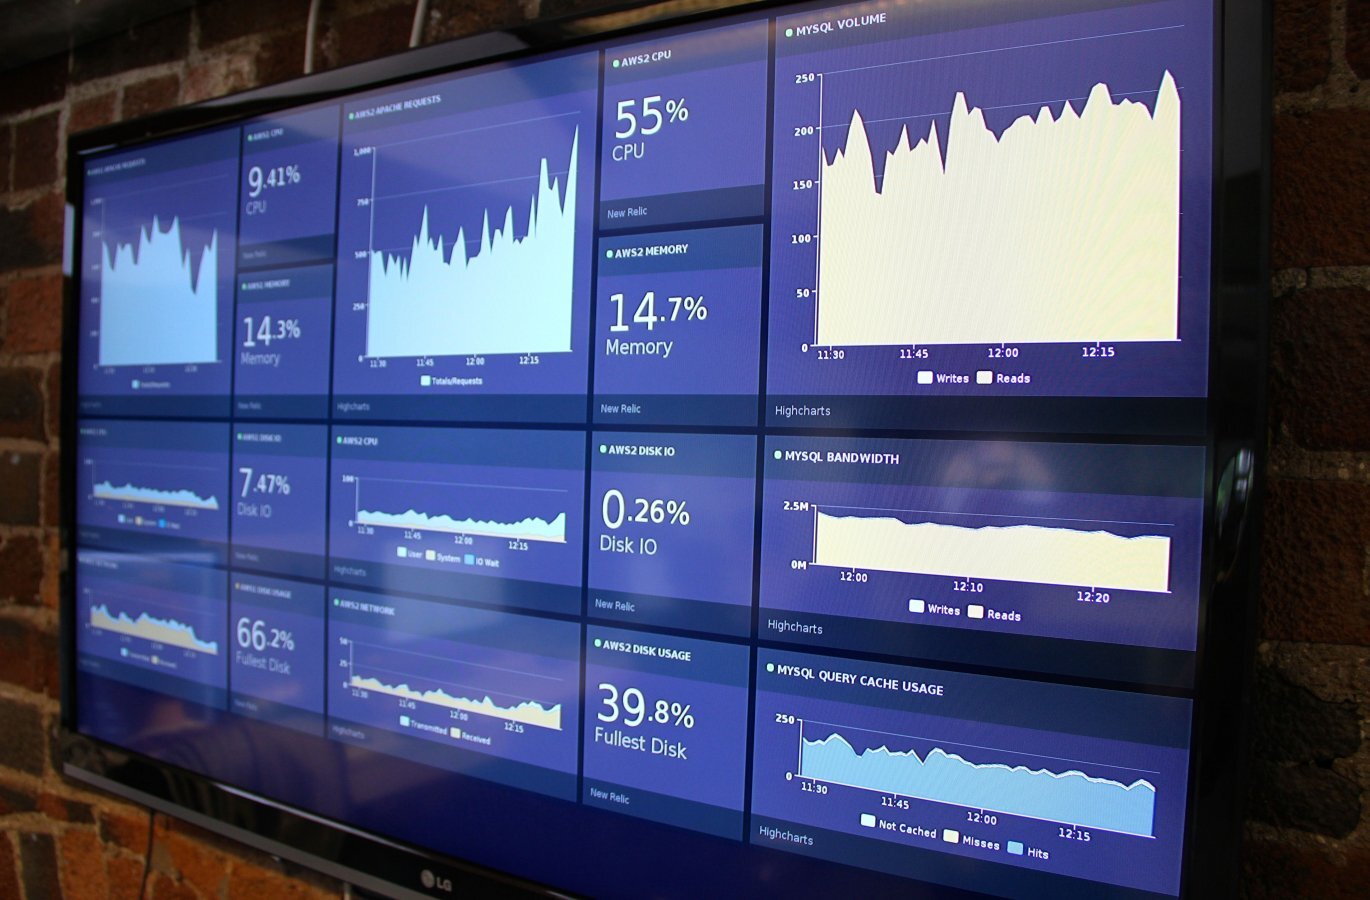
Dashboard Design
Once you have visualized your data, you need to design your dashboard. Your dashboard should be easy to read and understand. It should also be customizable so that you can tailor it to your specific needs.
Data Security
Data security is an important consideration when building a real-time reporting dashboard. You need to ensure that your data is protected from unauthorized access and use. There are a number of different data security measures that you can implement, such as encryption, access control, and intrusion detection.
Conclusion
Building a real-time reporting dashboard can be a complex and time-consuming process. However, the benefits of having a real-time reporting dashboard can be significant. By following the steps outlined in this article, you can build a real-time reporting dashboard that will help you improve your business.
Keyword Tags
- Real-time reporting
- Data visualization
- Dashboards
- Data analytics
- Business intelligence