Performance Monitoring in Linux with Top and Htop
Monitoring system performance is crucial for maintaining the health and stability of Linux environments. Top and Htop are powerful command-line tools that provide detailed insights into system resource utilization.
Top
- Overview of system processes, CPU, memory, and I/O usage
- Sortable columns for easy identification of high-resource consumers
- Interactive commands for process management (e.g., kill, pause)
- Command:
top
Example:
topHtop
- Similar to Top but with an enhanced interactive interface
- Graphical display of CPU usage, memory consumption, and disk activity
- Tree-like view for navigating processes and sub-processes
- In-depth information about individual processes, including threads
- Command:
htop
Example:
htopUsage
Both Top and Htop can be customized using command-line flags. For example:
- To sort Top by CPU usage:
top -o %CPU - To filter Htop processes by name:
htop -s PIDNAME
Performance Metrics
CPU:
- %CPU: Percentage of CPU time used by each process
- USR, SYS, NI, ID, WA: Time spent in various CPU states
Memory:
- MEM%: Percentage of physical memory used by each process
- VIRT: Total virtual memory used by each process
- RES, CODE, DATA: Breakdown of memory usage
I/O:
- %IO: Percentage of time spent in I/O operations
- WCHAN: The kernel function where a process is waiting for I/O
Benefits
- Real-time monitoring of system performance
- Identification of bottlenecks and performance issues
- Troubleshooting system problems
- Optimization of resource utilization
- Proactive maintenance and capacity planning## Performance Monitoring In Linux With Top And Htop
Executive Summary
Top and Htop are two powerful command-line tools for monitoring system performance in Linux. They provide a wealth of information about CPU, memory, processes, and other system resources to help system administrators identify and resolve performance issues. This comprehensive guide explains how to use Top and Htop and dives into concepts like load average, process states, and resource utilization metrics to effectively monitor and manage Linux systems. Whether you’re a seasoned system administrator or just starting out, this definitive guide on performance monitoring with Top and Htop will equip you with the knowledge and skills to ensure peak performance of your Linux systems.
Introduction
Performance monitoring is crucial for maintaining the health and efficiency of Linux systems. Top and Htop are indispensable tools in this domain, offering real-time insights into system resource utilization. Contrary to other tools that focus on specific metrics, Top and Htop provide a holistic view of system performance, empowering users to pinpoint performance bottlenecks and optimize system configurations. With this guide, you’ll delve into the intricacies of Top and Htop, enabling you to harness their full potential for effective performance monitoring and proactive system management.
Top
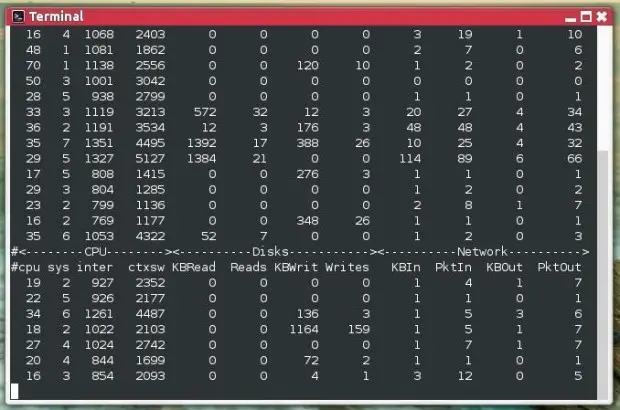
Top is a versatile monitoring tool that displays a continuously updated snapshot of system activity in a text-based interface. It presents information about CPU usage, memory utilization, processes, and other system metrics in an interactive format.
- CPU Load Indicators: Top showcases a succinct overview of CPU consumption, including percentage utilization for individual cores and an overall system load average. The load average represents the average number of processes in the system’s run queue over the past 1, 5, and 15 minutes.
- Process Management: Top offers insights into running processes, displaying their process ID (PID), user, CPU and memory usage, and the command associated with the process. You can terminate processes, adjust priorities, and modify process scheduling parameters directly within Top’s interface.
- Memory Utilization Breakdown: Top provides a detailed breakdown of memory usage, including total memory, available memory, and memory utilization by different categories like buffers, cache, and shared memory.
- Swap Space Monitoring: If the system utilizes virtual memory, Top shows swap space usage, indicating the extent to which the system relies on disk space to supplement physical memory.
- Interactive Interface: Top allows for interactive navigation using keyboard commands to sort processes by various metrics, change display options, and filter results based on specific criteria.
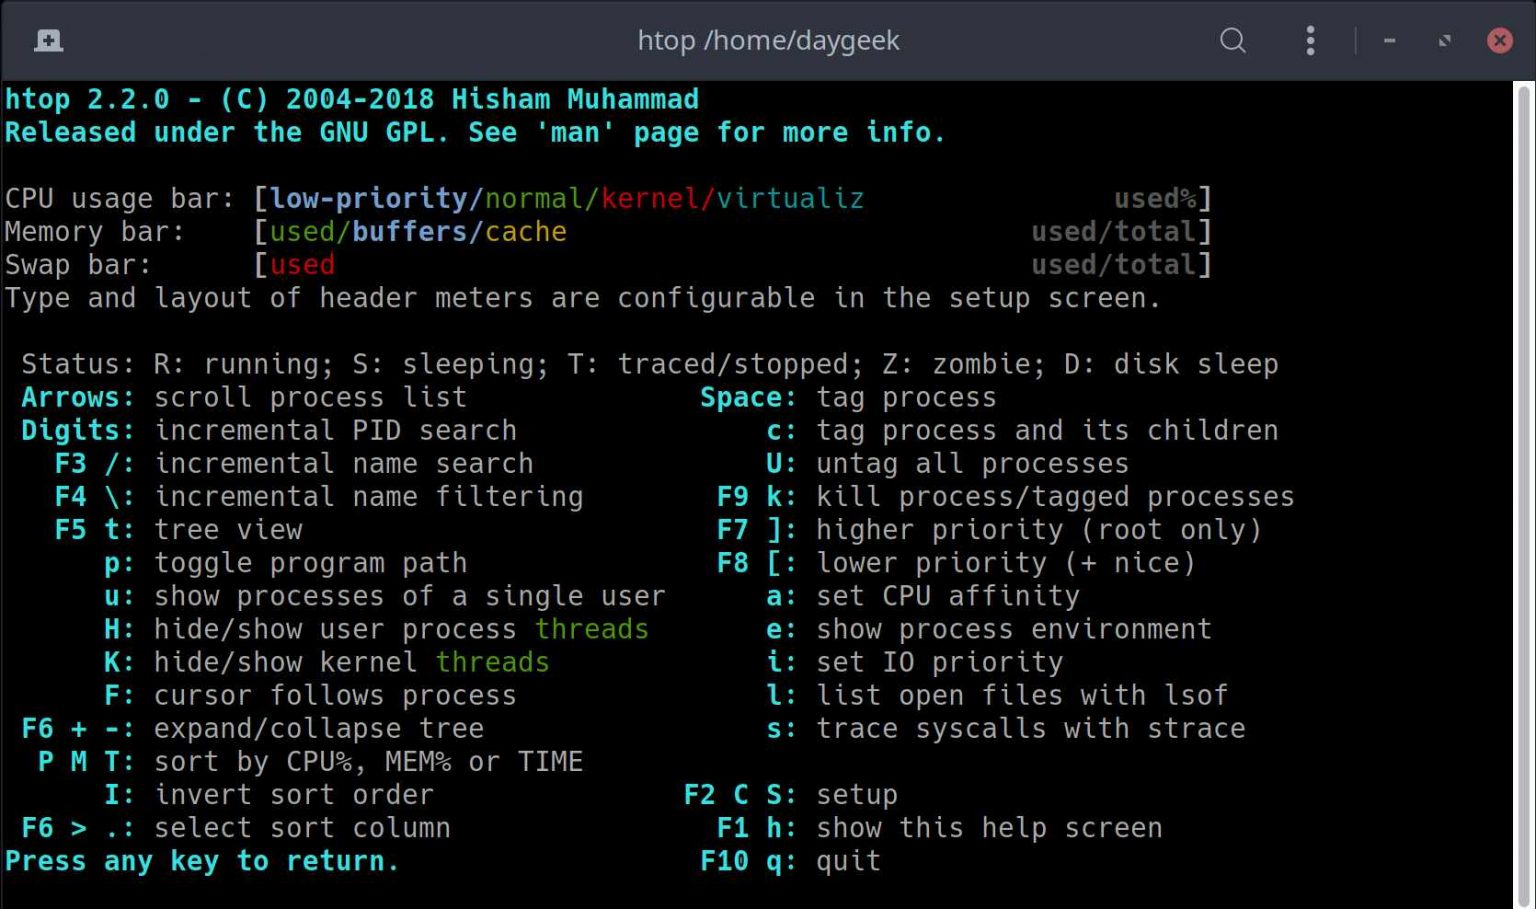
Htop
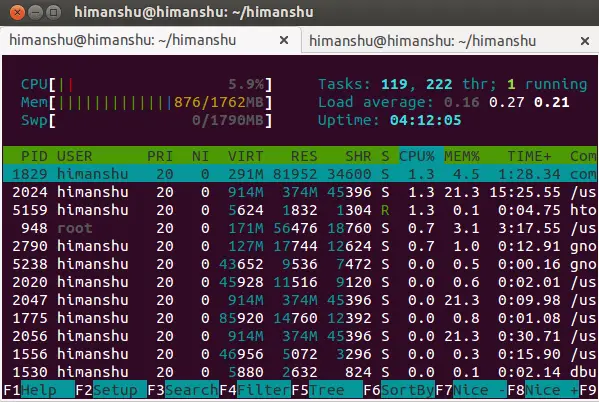
Htop is an advanced interactive process viewer that extends the functionality of Top with a user-friendly graphical interface. It offers intuitive navigation and visualizations of system resources.
- Enhanced Process Management: Htop provides detailed process information, including thread counts, I/O statistics, and open files. The interactive interface allows for quick process searching, filtering, and termination.
- Tree View of Processes: Htop presents a hierarchical view of processes, displaying parent-child relationships and resource consumption by process groups.
- Sorting and Filtering: Htop enables sorting and filtering of processes based on various parameters, including CPU usage, memory consumption, and process names.
- Resource Utilization Graphs: Htop provides graphical representations of CPU and memory utilization, offering a visual overview of resource consumption trends.
- Customization and Configurability: Htop allows for customization of the interface, including altering column visibility, changing color schemes, and configuring refresh rates.
Performance Monitoring Metrics
CPU Utilization
CPU utilization refers to the percentage of time the CPU is actively executing instructions. Monitoring CPU utilization is crucial to ensure optimal performance and prevent resource starvation.
- Idle Time: The time when the CPU is not actively executing any tasks or waiting for data.
- User Time: The time spent by the CPU executing user-space processes.
- System Time: The time spent by the CPU executing kernel-space processes.
- I/O Wait Time: The time spent by the CPU waiting for I/O operations to complete.
- Steal Time: The time when the CPU is utilized by processes running on other virtual processors in a virtualized environment.
Memory Utilization
Memory utilization refers to the amount of physical memory being used by the system. Closely monitoring memory utilization helps prevent memory leaks and out-of-memory errors.
- Total Memory: The total amount of physical memory installed on the system.
- Available Memory: The amount of memory that is not currently being used by applications or the operating system.
- Used Memory: The amount of memory that is currently being used by applications and the operating system.
- Buffers: Memory that is used to cache frequently accessed data for faster retrieval.
- Cache: Memory that is used to store recently used data for quick access.
Process States
Understanding process states is essential for identifying and troubleshooting performance issues.
- Running: Processes that are currently executing.
- Runnable: Processes that are ready to run but are waiting for CPU time.
- Blocked: Processes that are waiting for I/O operations to complete.
- Sleeping: Processes that are not currently executing but are not waiting for any specific event.
- Stopped: Processes that have been terminated or suspended.
Conclusion
Mastering Top and Htop is paramount for effective performance monitoring in Linux environments. These tools offer a comprehensive view of system resources, aiding in the identification and resolution of performance bottlenecks. By leveraging their capabilities, you can optimize system configurations, troubleshoot performance issues, and ensure peak performance of your Linux servers. Whether you’re a seasoned system administrator or just starting to delve into performance monitoring, this guide has equipped you with the knowledge and skills to harness the power of Top and Htop to keep your systems running smoothly and efficiently.
Keyword Phrase Tags
- Linux Performance Monitoring
- Top Command Tutorial
- Htop Usage Guide
- CPU Utilization Analysis
- Memory Management in Linux
This is a great resource for anyone who wants to learn how to monitor system performance in Linux. I’ve been using top and htop for years and they’re invaluable tools.
These tools are awesome! I’ve been using them for a while now and they’ve helped me identify and fix several performance problems.
I’ve been using top for years, but I never knew about htop. This looks like a great tool! I’ll have to check it out.
I’m not sure what all this stuff means, but it looks complicated. I’ll stick with using the GUI tools.
This is a waste of time. There are much better tools out there for monitoring system performance.
I’ve been using top and htop for years and they’ve never let me down. I highly recommend them to anyone who wants to monitor system performance in Linux.
I’m not sure why you would need to use these tools. The default system monitoring tools are good enough for most people.
I’m not a Linux expert, but this article was easy to understand. I learned a lot about top and htop.
I’m a Linux expert and I still learned a few things from this article. Thanks!
This article is great! I’m going to use it to teach my students about system performance monitoring.