Debugging Linux Applications with Gdb
Gdb (GNU Debugger) is a powerful command-line tool that allows software developers to debug their C or C++ applications. In Linux environments, Gdb offers an extensive set of features to assist in debugging, including line-by-line code execution, memory inspection, and breakpoint management.
Setting up Gdb

To use Gdb, you’ll need to install it on your Linux system. Depending on your distribution and package manager, the installation command may vary. On Debian-based systems, you can use:
sudo apt-get install gdbStarting Gdb
To start debugging with Gdb, you’ll need to launch it and tell it the program you want to debug. You can do this by typing the following command in your terminal:
gdb <program-name>For example, to debug the my-program executable, you would type:
gdb my-programDebugging Commands
Gdb offers a wide range of commands for debugging purposes. Some of the most commonly used commands include:
run: Starts the program in debugging mode.step: Executes a single line of code.next: Executes the next line of code, skipping any function calls.continue: Continues execution until the next breakpoint or error.break: Sets a breakpoint at a specified line or function.watch: Sets a watch on a variable, which will stop execution if the variable’s value changes.
Inspection and Modification
Gdb also allows you to inspect and modify the state of your program during debugging. You can use the following commands:
print: Prints the value of a variable or expression.set: Sets the value of a variable.x: Examines the contents of memory.disassemble: Displays the assembly code for a function.
Conditional Breakpoints
Gdb supports setting breakpoints with conditions, allowing you to execute certain commands only when specific criteria are met. For example, you could set a breakpoint that only triggers when a particular variable reaches a certain value.
Backtrace and Stack Examination
In the event of an error or crash, Gdb provides a backtrace, which shows the chain of function calls that led to the current state. You can examine the stack frames to determine where the error originated.
Advanced Debugging Techniques
Gdb offers several advanced techniques, such as:
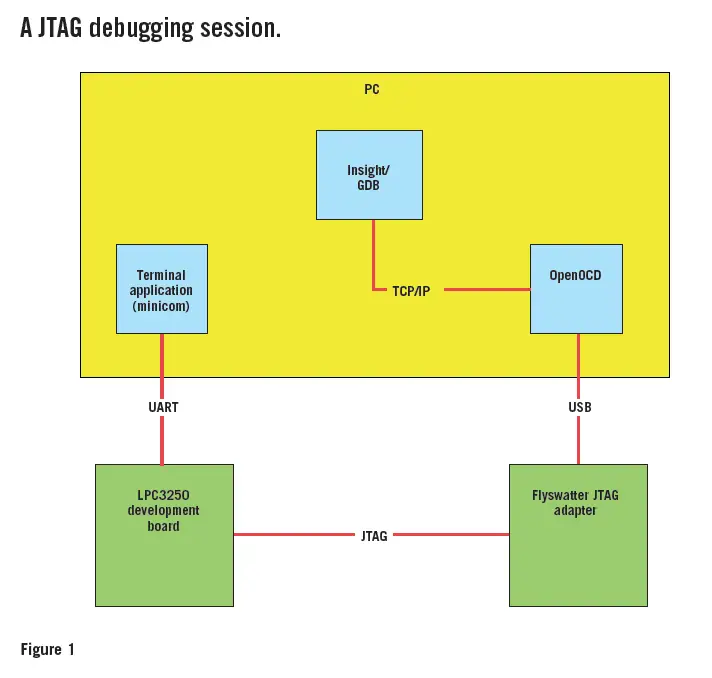
- Remote debugging: Allows debugging processes running on remote machines.
- Python scripting: Enables automating debugging tasks with Python scripts.
- Symbol files: Helps Gdb map addresses to symbols, making debugging more readable.
By using Gdb effectively, Linux application developers can significantly improve their debugging capabilities, leading to faster and more efficient development processes.
This is an awesome article. Thanks for sharing!
I don’t understand. Can you explain it in more detail?
This article is very informative. I learned a lot about using GDB.
I disagree with your conclusion. I think GDB is actually pretty easy to use.
Isn’t GDB a bit outdated? Are there any more modern alternatives?
GDB is the best debugger ever! I can’t imagine debugging Linux applications without it.
I love GDB. It’s like having a superpower when it comes to debugging.
Is GDB cross-platform?
I wish there was a GDB for Windows.
This article is too long. Can’t you summarize it in a few sentences?
I’m new to GDB. Any tips for beginners?
I’m a GDB expert. Ask me anything!
Is GDB open source?