
Debugging and Diagnosing Performance Issues in Visual Studio
Visual Studio provides various powerful tools and features to assist developers in debugging and diagnosing performance issues in their applications. These tools help identify bottlenecks, memory leaks, and other issues that may be hindering the performance of the application.
1. Performance Profiler:
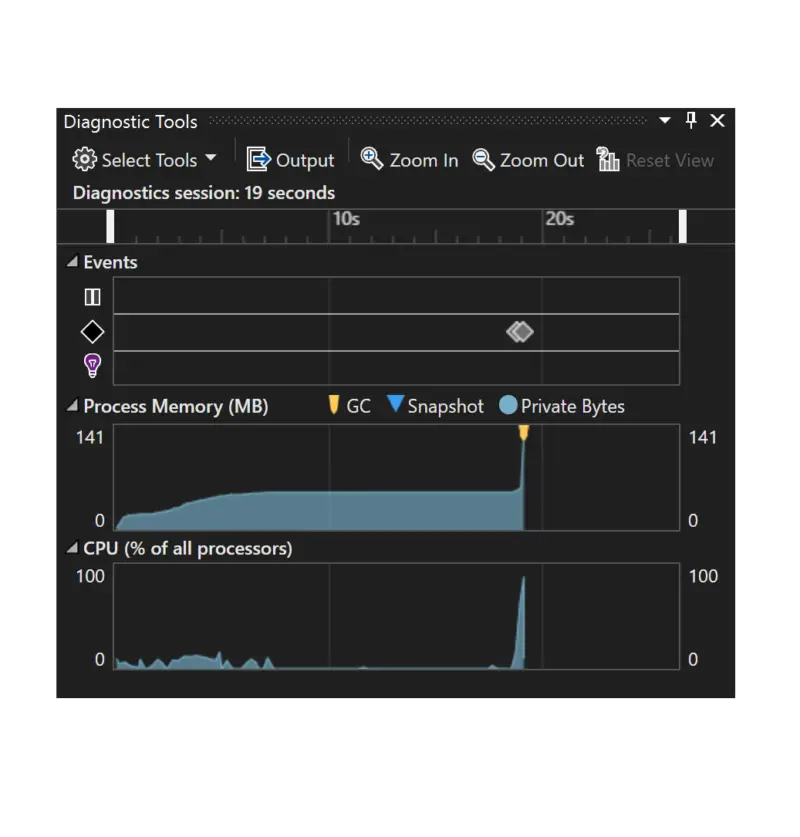
The Performance Profiler in Visual Studio allows developers to analyze the performance of their application by monitoring various metrics such as CPU usage, memory usage, and thread activity. It also provides a timeline view of the application’s execution, making it easier to pinpoint performance problems.
2. Memory Profiler:
The Memory Profiler helps identify memory leaks and other memory-related issues. It provides detailed information about the memory usage of the application, including the allocation and deallocation of memory objects, allowing developers to identify potential memory leaks.
3. CPU Usage Profiler:
The CPU Usage Profiler analyzes the CPU usage of the application and identifies hotspots, which are functions or methods that consume a significant amount of CPU time. This information helps developers optimize the code and improve the application’s performance.
4. Thread Profiler:
The Thread Profiler monitors the activity of threads within the application, providing insights into thread contention, deadlocks, and other threading issues. By analyzing the thread activity, developers can identify potential bottlenecks and optimize the application’s multithreading strategy.
5. Sampling Profiler:
The Sampling Profiler collects performance data about the application’s execution at regular intervals, providing a high-level overview of the application’s performance. It helps developers quickly identify performance issues and potential bottlenecks.
6. IntelliTrace:
IntelliTrace is a powerful debugging tool that allows developers to record and replay the execution of their application, including all function calls, method invocations, and variable values. This feature is particularly useful for diagnosing intermittent and hard-to-reproduce performance issues.
7. Performance Tips and Recommendations:
Visual Studio provides inline performance tips and recommendations to help developers write efficient and performant code. These suggestions are based on best practices and can be applied to improve the performance of the application significantly.
8. Performance Counters:
Performance counters are metrics that provide insights into the performance of various aspects of the application, such as memory usage, CPU utilization, and network traffic. Visual Studio allows developers to add performance counters to their applications and monitor them during runtime, enabling them to identify performance trends and bottlenecks.
9. Code Profiling:
Code profiling involves analyzing the execution time of specific parts of the code to identify performance bottlenecks. Visual Studio allows developers to profile their code and generate reports that highlight the most time-consuming functions and methods, helping them optimize the code and improve performance.
10. Just-In-Time (JIT) Compiler:
The JIT compiler in Visual Studio can generate optimized machine code during runtime, improving the performance of the application. Developers can use the JIT optimization settings to fine-tune the compiler’s behavior and further enhance the performance of their applications.
By utilizing the aforementioned tools and features, developers can effectively debug and diagnose performance issues in their Visual Studio applications, leading to improved performance, responsiveness, and overall user satisfaction.## Debugging and Diagnosing Performance Issues In Visual Studio
Executive Summary
Visual Studio is an integrated development environment (IDE) used for developing computer programs. It offers different features and tools that can help developers debug and diagnose performance issues in their code. This article will cover the top 5 subtopics related to debugging and diagnosing performance issues in Visual Studio, including the significance of each subtopic. Additionally, this article will provide relevant keyword tags to help with further research on this topic.
Introduction
Debugging and diagnosing performance issues in Visual Studio is vital for developers to ensure the efficiency and reliability of their code. Visual Studio provides various features and tools to help identify and resolve these issues. By utilizing these tools effectively, developers can quickly identify and correct any performance bottlenecks. This article will provide a comprehensive guide to identifying and understanding different ways to debug and diagnose performance issues using the tools available in Visual Studio.
Understanding Performance Analysis Tools
Performance analysis tools play a crucial role in identifying and diagnosing performance issues in Visual Studio. These tools provide detailed information about the behavior of the program, such as CPU usage, memory usage, and event timings.
-
Performance Profiler: This tool helps identify performance bottlenecks in code. Developers can gather insights into performance impact through graphs and flame visualizations.
-
Memory Usage: Analyze application memory allocation and usage patterns to detect memory leaks.
-
Event Tracing for Windows (ETW): ETW helps monitor events in the system and can help troubleshoot performance issues.
-
Tracepoints: Developers define custom locations in the code to record detailed execution data.
-
CPU Sampling: Captures stack traces at regular intervals to analyze where the CPU is spending its time.
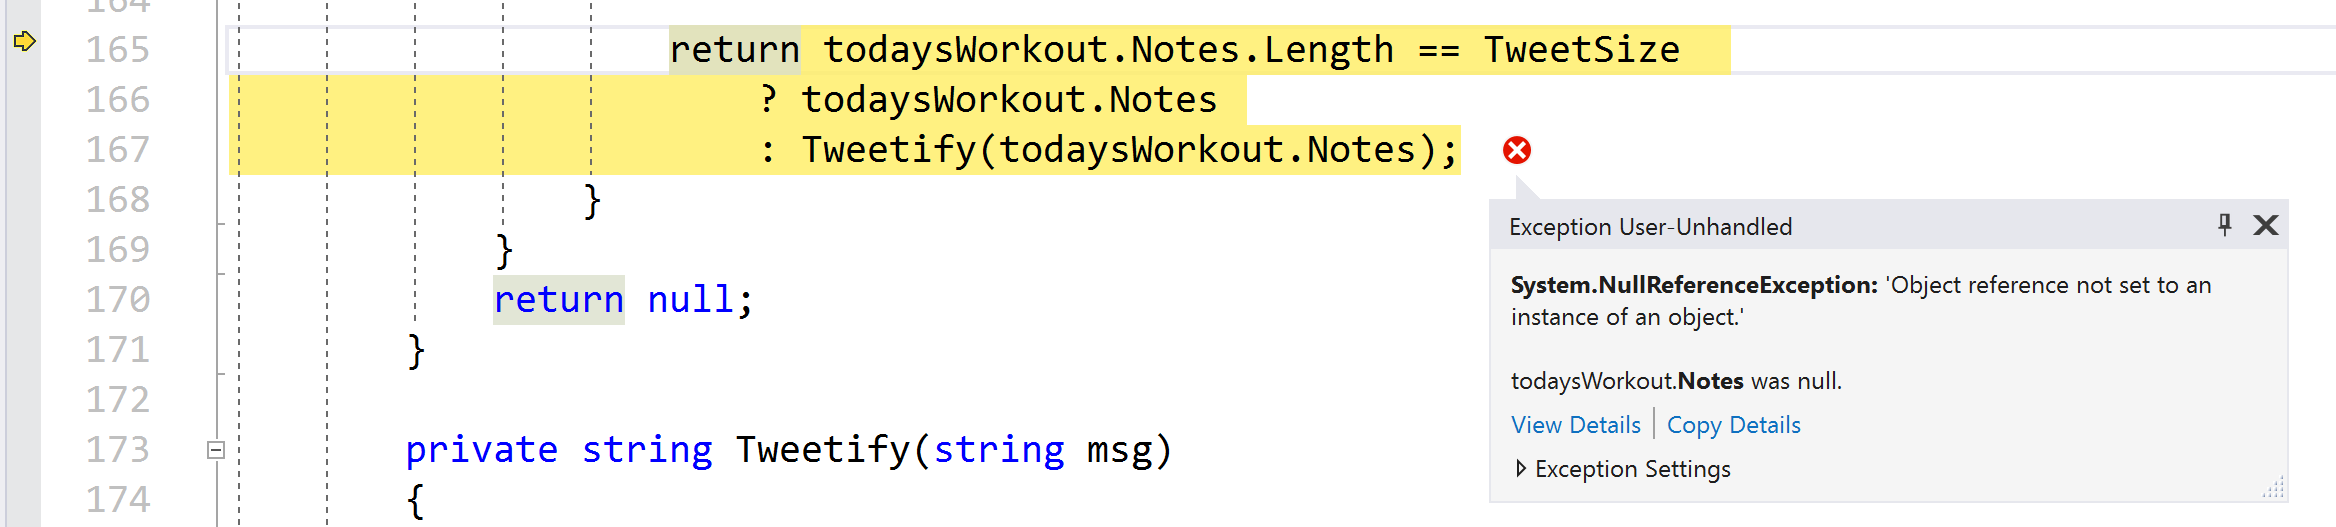
Utilizing Debugging Tools
Debugging tools within Visual Studio allow developers to step through the code and analyze its behavior at specific points. This helps identify issues that may not be apparent in static analysis.
-
Breakpoints: These allow developers to pause the execution of the program at specific lines of code.
-
Data Inspection: Visual Studio enables examining the values of variables and objects during debugging.
-
Call Stack: Helps analyze the sequence of function calls and identify potential issues.
-
Watch Expressions: Developers can create expressions to monitor specific values while debugging.
-
Output Windows: Visual Studio provides various output windows to display diagnostic messages and other useful debugging information.
Efficient Debugging Techniques
Effective debugging involves employing techniques that minimize the time spent identifying and resolving issues.
-
Start with Small Test Cases: Begin by debugging small test cases that demonstrate the problem, making it easier to identify the root cause.
-
Use Breakpoints Strategically: Set breakpoints at critical points to understand the flow of execution and isolate the issue.
-
Leverage Data Inspection: Use data inspection tools during debugging to gain insights into the behavior of the code.
-
Enable Just My Code: This feature filters out irrelevant steps not related to the developer’s code.
-
Utilize Output Windows: These windows often provide valuable information for troubleshooting various issues.
Tips to Improve Code Performance
Enhancing code performance helps reduce development time and improves the user experience.
-
Optimize Algorithms: Choose efficient algorithms and data structures for your code.
-
Identify Memory Leaks: Use debugging tools to detect memory leaks and free resources properly.
-
Minimize Unnecessary Function Calls: Repetitive function calls can impact performance; aim to reduce them.
-
Optimize Loops: Structure loops efficiently to minimize iterations and improve performance.
Implications of Performance Issues
Ignoring performance issues can have severe consequences, impacting the user experience and overall program stability.
-
Increased Development Time: Poor performance can lengthen the development process due to the need for constant debugging and optimization.
-
Poor User Experience: Unresponsive or slow programs can frustrate users, potentially resulting in program abandonment.
-
System Instabilities: Performance issues may lead to system freezes, crashes, and other stability problems.
Conclusion
Visual Studio offers various features and tools to help developers identify and resolve performance issues in their code. By understanding the purpose of performance analysis and debugging tools, mastering effective debugging techniques, and implementing performance improvement strategies, developers can enhance code efficiency and create stable and responsive applications. Utilizing these tools and techniques effectively allows developers to identify and resolve performance bottlenecks, resulting in code that runs smoothly and meets user expectations.
Keyword Phrase Tags
- Performance Analysis in Visual Studio
- Debugging Techniques in Visual Studio
- Optimizing Code in Visual Studio
- Performance Implications in Visual Studio
- Visual Studio Performance Tools
Great article, very helpful !
I was having some performance issues in my code and this article helped me to identify the problem and fix it
This article is useless, it didn’t help me at all. I’m still having the same performance issues
I found this article to be very informative. It provided me with some new insights into how to debug and diagnose performance issues in Visual Studio
I disagree with some of the points made in this article. I think there are better ways to debug and diagnose performance issues in Visual Studio
This article is so ironic. It’s about debugging and diagnosing performance issues, but it’s full of errors itself
This article is so sarcastic. It’s like the author is trying to make fun of people who have performance issues in Visual Studio
This article is so comical. It’s like a joke about debugging and diagnosing performance issues in Visual Studio
I can’t believe I wasted my time reading this article. It was a complete waste of time
This article was very helpful. I learned a lot about debugging and diagnosing performance issues in Visual Studio
I found this article to be very informative. It provided me with some new insights into how to debug and diagnose performance issues in Visual Studio