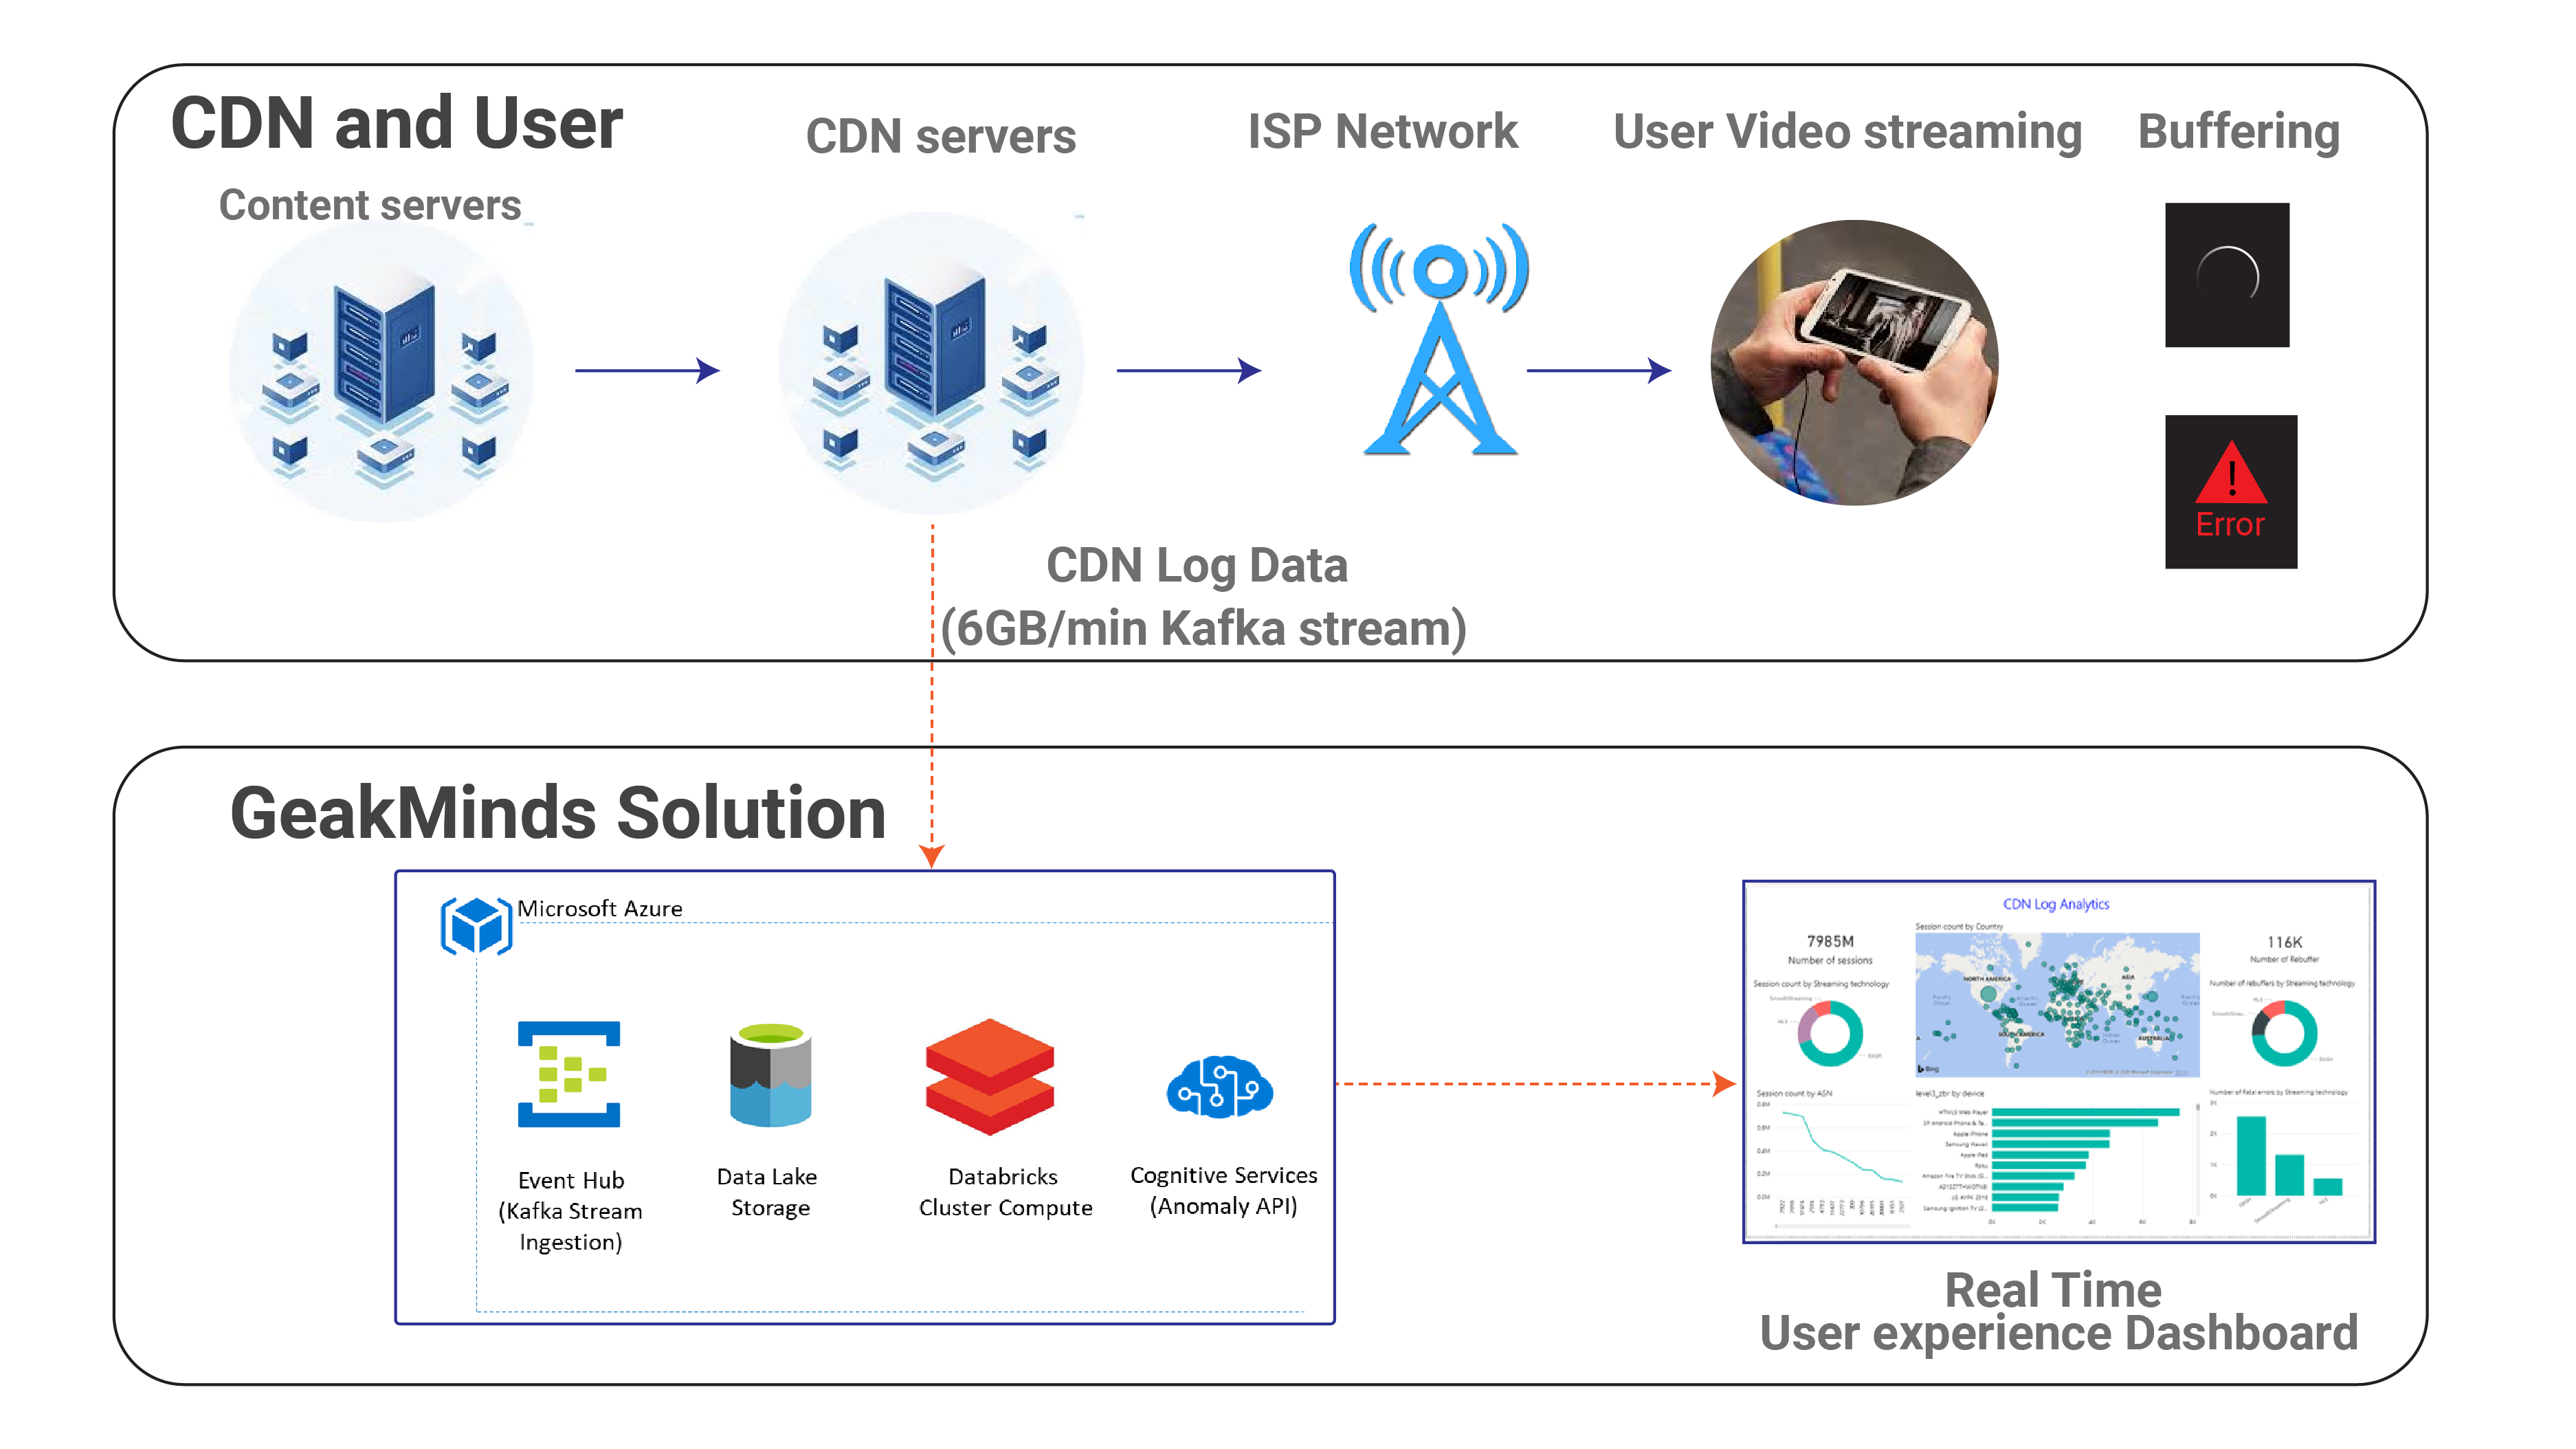
Understanding CDN Analytics

CDN (Content Delivery Network) analytics provides valuable insights into your website or application’s performance and user engagement. By leveraging these metrics, you can optimize your CDN configuration and enhance your audience’s experience.
Key CDN Analytics Metrics

- Requests: The total number of requests made to your CDN.
- Bandwidth: The amount of data transferred over your CDN.
- Cache Hit Rate: The percentage of requests that were served from the CDN’s cache.
- Average Request Time: The average time it takes for a request to be fulfilled.
- Origin Traffic: The amount of traffic that is not cached and must be fetched from the origin server.
- Geo Distribution: The geographical distribution of your audience.
- Top Referrers: The sources that are directing the most traffic to your website.
- Device Type and OS: The types of devices and operating systems that are accessing your content.
- Page and Asset Performance: Specific insights into the performance of individual pages or assets.
Benefits of CDN Analytics
- Optimize CDN Configuration: Identify bottlenecks and areas for improvement to maximize performance.
- Understand Audience Behavior: Analyze user engagement and demographics to tailor your content and marketing strategies.
- Identify Performance Issues: Quickly detect and troubleshoot any performance degradations or outages.
- Track Progress Over Time: Monitor the effectiveness of CDN optimizations and identify trends.
- Informed Decision-Making: Use data-driven insights to make informed decisions about CDN deployment and content distribution.
How to Access CDN Analytics
CDN providers typically offer analytics dashboards or APIs that allow you to access these metrics. Common CDN analytics platforms include:
- Amazon CloudFront: Amazon CloudWatch
- Cloudflare: Dashboard, API, Logs
- Fastly: Analytics API, Log Analyzer
- Akamai: Control Center, Performance Platform
Analyzing CDN Analytics Data
- Review Requests and Bandwidth: Determine the overall traffic volume and identify any spikes or lulls.
- Monitor Cache Hit Rate: Aim for a high cache hit rate to reduce origin traffic and improve performance.
- Analyze Average Request Time: Investigate slow requests and consider optimizations such as file compression or image optimization.
- Identify Origin Traffic: Reduce origin traffic by optimizing cache policies or considering edge caching.
- Geo Distribution: Understand your audience’s geographical distribution and tailor content delivery strategies accordingly.
- Top Referrers: Target your marketing efforts towards the sources that generate the most traffic.
- Device Type and OS: Optimize content delivery for different device types and operating systems.
- Page and Asset Performance: Identify underperforming pages or assets and take steps to improve their load times.
By effectively utilizing CDN analytics, you can gain a comprehensive understanding of your audience, optimize your CDN configuration, and deliver a superior user experience across various devices and locations.## CDN Analytics: Understanding Your Audience and Traffic
Executive Summary
CDN analytics is a vital tool for understanding how your audience interacts with your website. By gathering data on traffic sources, user behavior, and device characteristics, you can gain valuable insights into your target market and optimize your website performance. This article will delve into the key metrics of CDN analytics, explaining how to interpret and use them to enhance your online presence.
Introduction
Content delivery networks (CDNs) play a crucial role in delivering fast and reliable content to website visitors. By caching content on servers located closer to users, CDNs minimize latency and improve user experience. CDN analytics provides detailed information on how users access and consume your content, enabling you to make informed decisions about website optimization.
Frequently Asked Questions
-
What data does CDN analytics provide?
- CDN analytics collects data on traffic sources, user behavior, device characteristics, and content performance.
-
How do I access CDN analytics?
- Most CDN providers offer dashboards and interfaces for accessing analytics data.
-
How can I use CDN analytics to improve my website?
- CDN analytics can help optimize content delivery, identify user pain points, and improve website performance.
Key CDN Analytics Metrics
1. Traffic Sources
- Unique Visitors: The number of unique individuals who visit your website within a given time period.
- Page Views: The total number of pages viewed on your website.
- Bounce Rate: The percentage of visitors who leave your website after viewing only one page.
- Average Session Duration: The average time spent by visitors on your website.
2. User Behavior
- Most Popular Pages: The pages that receive the highest number of visits.
- Click-Through Rate: The percentage of visitors who click on a specific link or button.
- Conversion Rate: The percentage of visitors who take a desired action, such as filling out a form or making a purchase.
- Exit Pages: The pages where visitors leave your website.
3. Device Characteristics
- Desktop vs. Mobile: The percentage of visitors accessing your website from desktop or mobile devices.
- Operating Systems: The distribution of operating systems used by visitors.
- Browsers: The most popular browsers used to access your website.
- Connection Speed: The average internet connection speed of visitors.
4. Content Performance
- Load Time: The average time it takes for pages to load for users.
- Bytes Served: The total amount of data transferred from your website to visitors.
- Cache Hit Rate: The percentage of requests that are served from CDN caches without fetching content from the origin server.
- Origin Requests: The number of requests that are sent to your origin server for content that is not cached.
5. Geospatial Data
- Visitor Location: The geographic distribution of your website visitors.
- Top Cities: The cities with the highest number of website visits.
- Traffic Patterns: The time of day and day of week when your website receives the most traffic.
- Language Preferences: The languages preferred by your website visitors.
Conclusion
CDN analytics is an indispensable tool for website owners who want to optimize their content delivery and improve user experience. By understanding the traffic sources, user behavior, device characteristics, and content performance data, you can gain valuable insights into your target market and make informed decisions about website optimization. By leveraging CDN analytics, you can ensure that your website delivers a fast, reliable, and engaging experience for visitors.
Keyword Tags:
- CDN Analytics
- Traffic Analytics
- User Behavior Analytics
- Content Delivery Optimization
- Website Optimization
